Cross-Asset Monthly
Once a month, one note on the whole map. It sets out what markets price across rates, equities, credit, currencies and commodities, and how that changed over the month. Each asset class gets a short read with the evidence laid out beneath it. The note then works through the scenarios that would hurt a portfolio most and that markets price least. We take a view only when the evidence clearly points one way; where it does not, we say what would settle it.
The models behind this research: Macro scenario simulator and CTA positioning.
Part of the Macro bundle.
Structure
What's inside
- Key messages: the month's conclusions, stated up front.
- What markets price: the market's own numbers against a month earlier, from policy rates to the risks options price.
- Where the evidence points: a short read on each asset class, with a table beneath it that names every reading and the way it points.
- Scenarios: up to three that markets price little of, each with its trigger and what it would do to rates, equities, credit and a balanced portfolio.
- Priced vs possible: what each scenario would cost against the chance markets put on it.
- Signposts: the dates and data in the weeks ahead that would confirm or change the picture.
- Appendix: where valuations sit in their own history, and where trend followers stand.
Example excerpt · November 2026
An AI scare meets an inflation problem
Key messages
- Markets spent the month pricing two opposite risks: an AI-led equity scare that pulled front-end yields lower, and hot inflation that now has a December Fed hike fully priced.
- No asset class gives a clean signal this month. Credit comes closest: downtrends and a hiking Fed point to wider spreads, but solid growth and calm markets argue the other way, and Nvidia's results on 17 November could tip it.
- US yields are caught between hot inflation and heavy short positioning, with a Fed hold as the risk. The dollar has momentum but little selling left against it, and Brent hangs on the Iran talks.
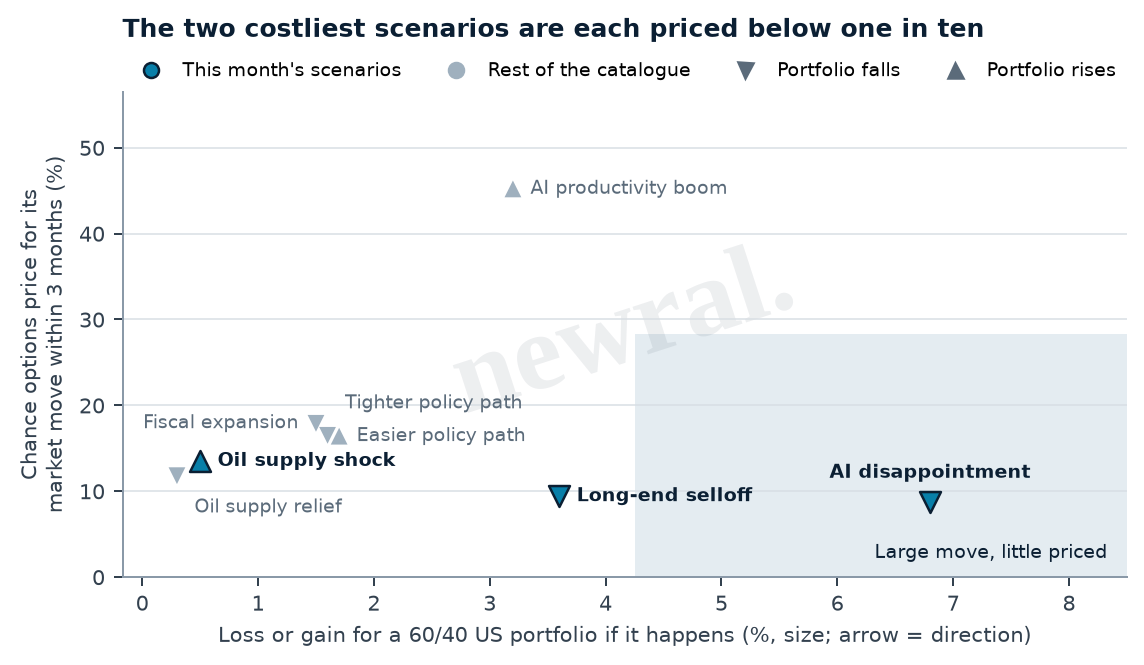
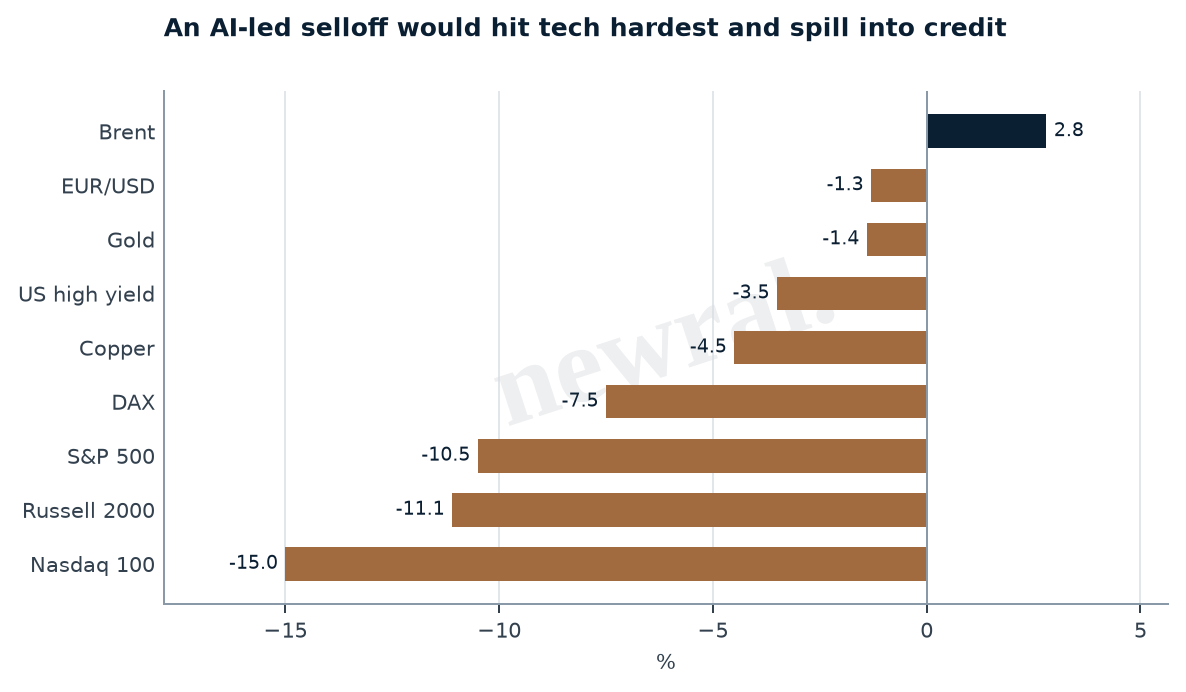
- AI disappointment is the scenario that matters most. It would cost a 60/40 US portfolio about 7%, yet options price it no more than the far milder long-end selloff.
From the evidence tables
Under each asset class's paragraph sits its evidence: for every market, the balance of the readings and each reading by name, with the way it points.

Sample note
Request a sample note
Tell us a little about yourself and we will send a recent note to your inbox.